
Figure 3.
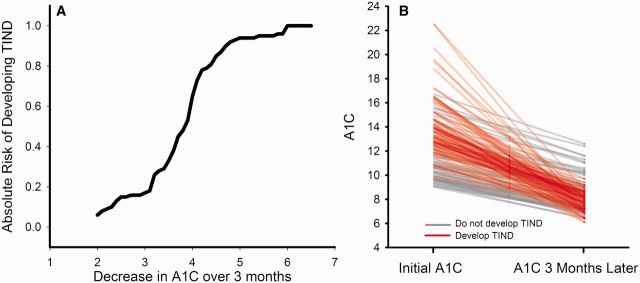
Risk of developing TIND. (A) A survival curve plotting the total number of patients (n = 168) with a decrease in HbA1c of ≥2% over 3 months. The absolute risk of developing TIND is plotted against the change in HbA1c over a 3-month period of time. (B) Individual data lines for all 168 individuals with a change in HbA1c ≥2% over 3 months. Individuals that develop TIND are shown with red lines and those that do not develop TIND are shown with grey lines.