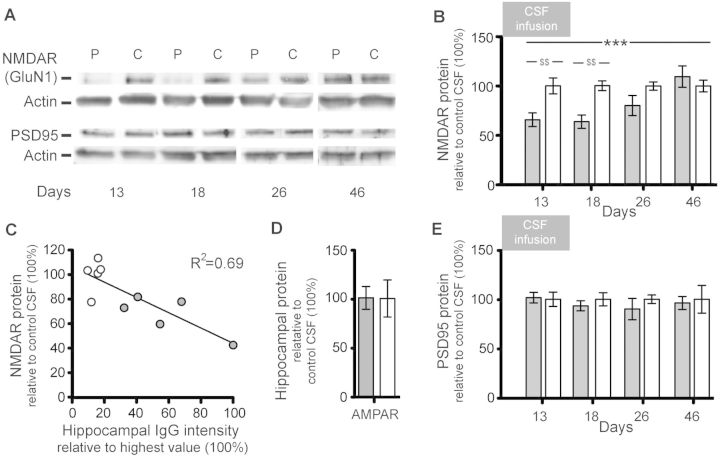
Figure 7.
Patients’ NMDAR antibodies selectively reduce the protein concentration of NMDAR in hippocampus of mice. (A) Representative immunoblots of proteins extracted from hippocampus of animals infused with patients’ CSF (P) or control CSF (C) sacrificed at the indicated time points and probed for expression of GluN1 (NMDAR), PSD95 and β-actin (loading control). Note that there is less visible GluN1 expression on Days 13 and 18. (B, D and E) Quantification of total NMDAR (B), AMPAR (D) or PSD95 (E) protein in animals treated with patients’ CSF (filled columns) or control CSF (open columns) sacrificed at the indicated time points (AMPAR Day 18 only, D). Results were normalized to β-actin (loading control). Mean band density of animals treated with control CSF was defined as 100%. Data are presented as mean ± SEM. For each time point six animals infused with patients’ CSF and six with control CSF were examined (for Days 26 and 46, only five animals treated with patient’s CSF were available). Significance of treatment effect was assessed by two-way ANOVA with an α-error of 0.05 (asterisks) and post hoc testing with Sidak-Holm adjustment ($). $$P < 0.01; ***P < 0.001. See Supplementary Table 2 for detailed statistics. (C) Correlation between concentration of human IgG bound to hippocampus (x-axis, highest hippocampal IgG intensity was defined as 100%) and hippocampal NMDAR protein concentration in mice sacrificed on Day 18 (R2 = 0.69, P = 0.003). Filled circles: mice infused with patients’ CSF (n = 5), open circles: mice infused with control CSF (n = 5).

