Figure 4.
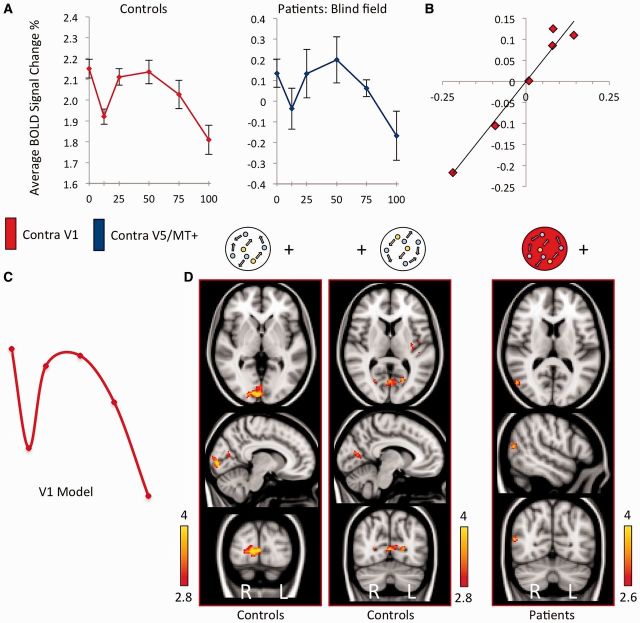
V1 response to motion coherence in controls, and the cortical regions active according to this V1 model in patients and controls. (A) Average % BOLD signal change as a function of stimulus coherence. The left graph (red) shows the response pattern in contralateral V1 of control subjects, averaged across hemispheres. The right graph (blue) shows the activation in V5/MT+ of the blind hemisphere in patients. Error bars represent normalized standard error of the mean. (B) Correlation of normalized signal change in contralateral V5/MT+ for patients blind hemifield, versus contralateral V1 activation in healthy controls, r = 0.98, P < 0.01. (C) Schematic of demeaned data-driven V1 model from control subjects for functional MRI response to motion coherence. (D) Active brain regions showing a significant relationship with motion coherence according to the V1 model in C. Results for each hemifield are shown separately for controls, and patients blind hemifield (highlighted by the red aperture). Fixed-effects analysis, corrected cluster threshold P < 0.05, pre-threshold masking applied to V1 and extrastriate cortex.

