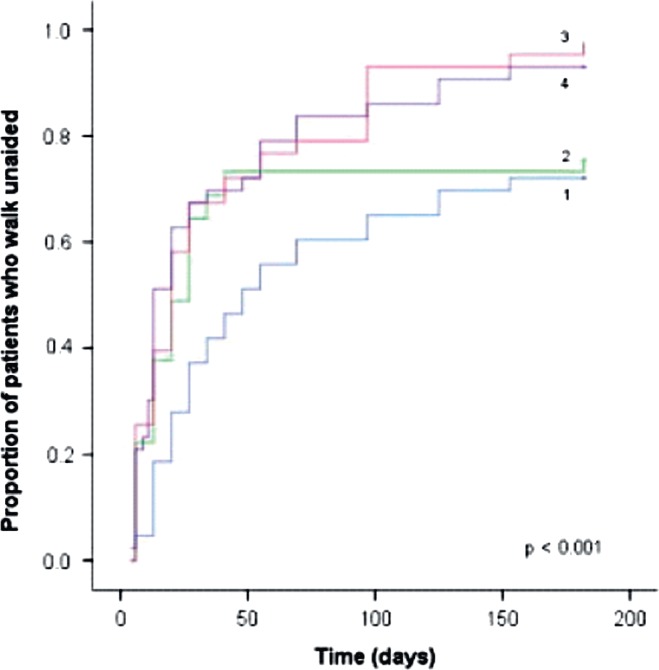
Figure 5.

Correlation of clinical outcome with increment in serum IgG after treatment in GBS. Proportion of patients who regained the ability to walk unaided in quartiles based on increase in serum immunoglobulin IgG 2 weeks after treatment with a standard high dose of intravenous immunoglobulin (IVIG). The Kaplan-Meier curves show the cumulative fractions of patients walking unaided along time grouped according to the quartiles (1–4) of increase in serum IgG. Cutoff values of ΔIgG for quartile 1: 3.99 g/l (n = 43); quartile 2: 3.99–7.30 g/l (n = 45); quartile 3: 7.31–10.92 g/l (n = 43); and quartile 4:10.92 g/l (n = 43). p Value is based on the log-rank test for trend. From Kuitwaard et al. (2009); reproduced with permission from the publisher.
