
Fig 1.
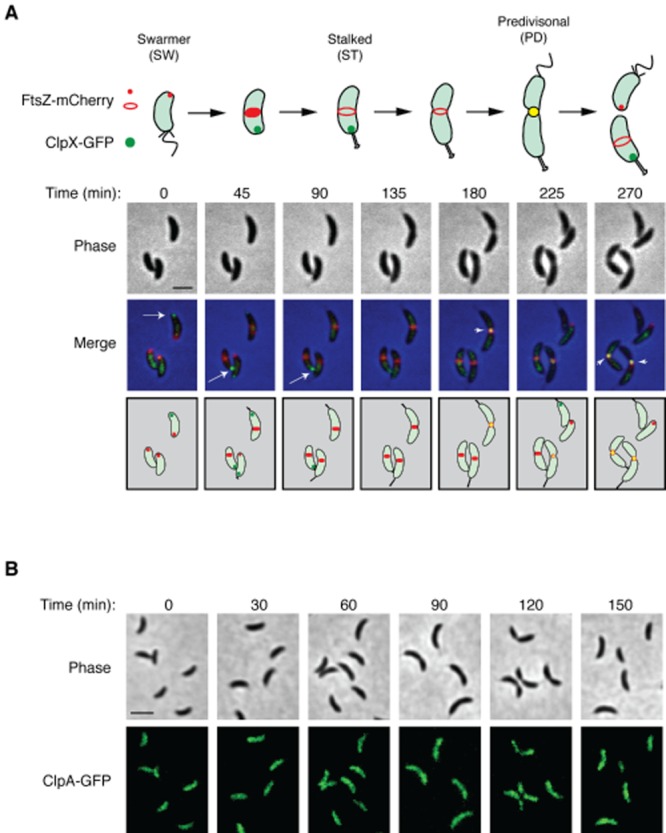
Dynamics of ClpX, ClpA and FtsZ subcellular localization.A. Cell cycle-dependent colocalization of ClpX–GFP and FtsZ–mCherry. Caulobacter bearing vanA::PvanA–clpX–egfp, xylX::PxylX–ftsZ–mCherry (LS5345) was induced with 0.5 mM vanillate for 2 h and 0.3% xylose for 1 h. Swarmer cells were isolated and allowed to proceed synchronously through the cell cycle on an agarose pad and imaged every 45 min using phase and fluorescence microscopy. A schematic of the cell cycle is shown below the panel. Scale bar represents 2.06 μm.B. Fluorescence microscopy of ClpA–GFP during the cell cycle. Caulobacter bearing pPvanA–clpA–egfp (LS5360) was induced with 0.5 mM vanillate for 2 h. Swarmer cells were isolated and allowed to proceed synchronously through the cell cycle. Aliquot of cells were sampled every 30 min, placed on an agarose pad and imaged using phase and fluorescence microscopy. Scale bar represents 2.6 μm.