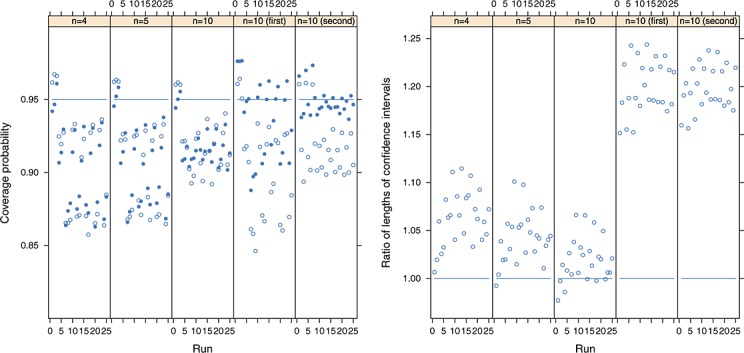
Figure 3.

Left panel: the coverage probabilities of the proposed refined (solid points) and conventional (hollow points), where the nominal coverage is 95% and where the between-study covariance matrix has been estimated using restricted maximum likelihood. Right panel: the ratio of the average lengths of nominal 95% confidence intervals using the refined and conventional procedures, where ratios greater than one indicate that the refined method provides greater average confidence interval lengths. A total of 10 000 simulations were used to estimate all coverage probabilities. In each panel, the first three plots show the results for complete data and n = 4,5,10, and the last two plots show the results for both outcomes when n = 10 and half the first outcomes are missing completely at random.
