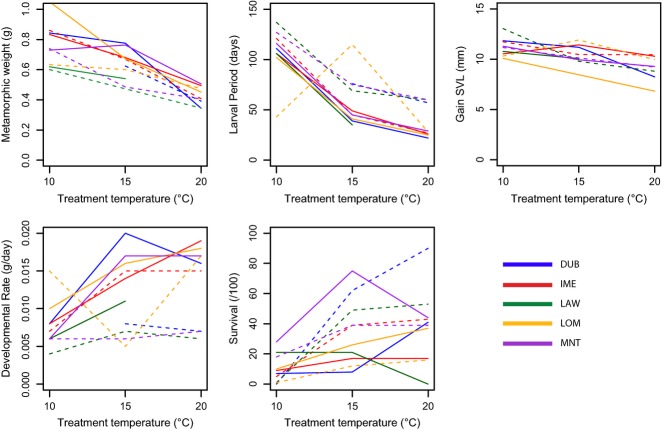
Figure 1.
Thermal reaction norms by site for each quantitative trait, demonstrating the relationship between treatment, mountain and altitude. Lines are solid for individuals from high-altitude sites and dashed for individuals from low-altitude sites on each mountain (see Table 1 for mountain name abbreviations). The slope of the line shows the level of phenotypic plasticity at each site (a steeper slope means higher phenotypic plasticity); the location of the line shows the value of the phenotypic trait in relation to other sites (lower down on the graph means a lower trait mean, relative to other sites); if lines are parallel, sites have a similar level of phenotypic plasticity. Values were not available for LAWHIGH at 20 °C and DUBLOW at 10 °C due to complete mortality during the experiment.

