Figure 3.
The SirA–DnaADI interface.
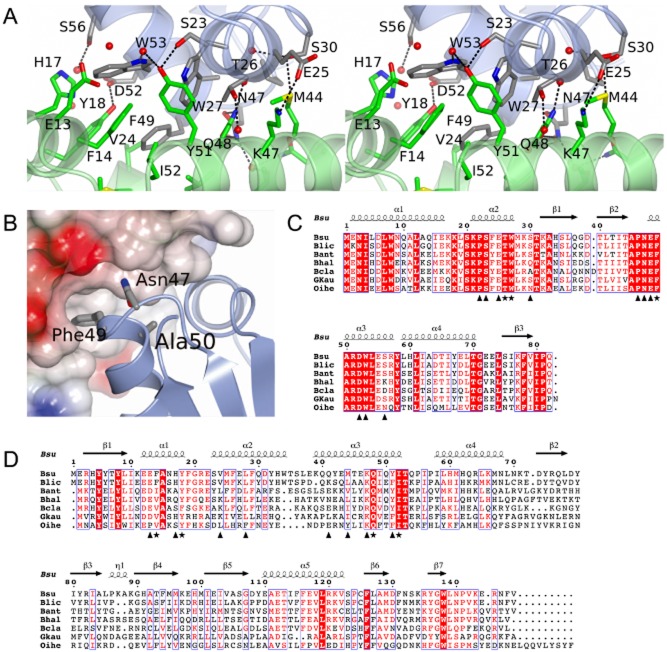
A. Stereoview of the complex between DnaADI (chain D) and SirA (chain C) represented as light blue and light green ribbons, respectively. Side-chains of labelled residues are displayed in cylinder format and coloured by atom type with nitrogen (blue), oxygen (red), sulphur (yellow) and carbons coloured in grey for DnaADI and green for SirA. Water molecules are represented as red spheres, and polar interactions are denoted by dashed lines.
B. Mapping onto the structure of DnaADI the sites corresponding to mutations in dnaA that allow growth of B. subtilis even when sirA is being overexpressed (Rahn-Lee et al., 2011). SirA is rendered as a partially transparent electrostatic surface and DnaADI as a ribbon with the side-chains of residues Asn47, Phe49 and Ala50 in cylinder format.
C and D. Alignment of the sequences of orthologues of DnaADI (C) and SirA (D) from selected Bacillus species; Bsu, B. subtilis; Blic, B. licheniformis; Bant, B. anthracis; Bhal, B. halodurans; Bcla, B. clausii; Gkau, Geobacillus klaustophilus; Oihe, Oceanobacillus iheyensis. Symbols below the alignments indicate interfacial residues in the respective molecules contributing to the core (asterisks) and the rim (triangles). Secondary structure elements and residue numberings are displayed above the alignment. The images were created using ESPript (Gouet, 2003).

