
Figure 6.
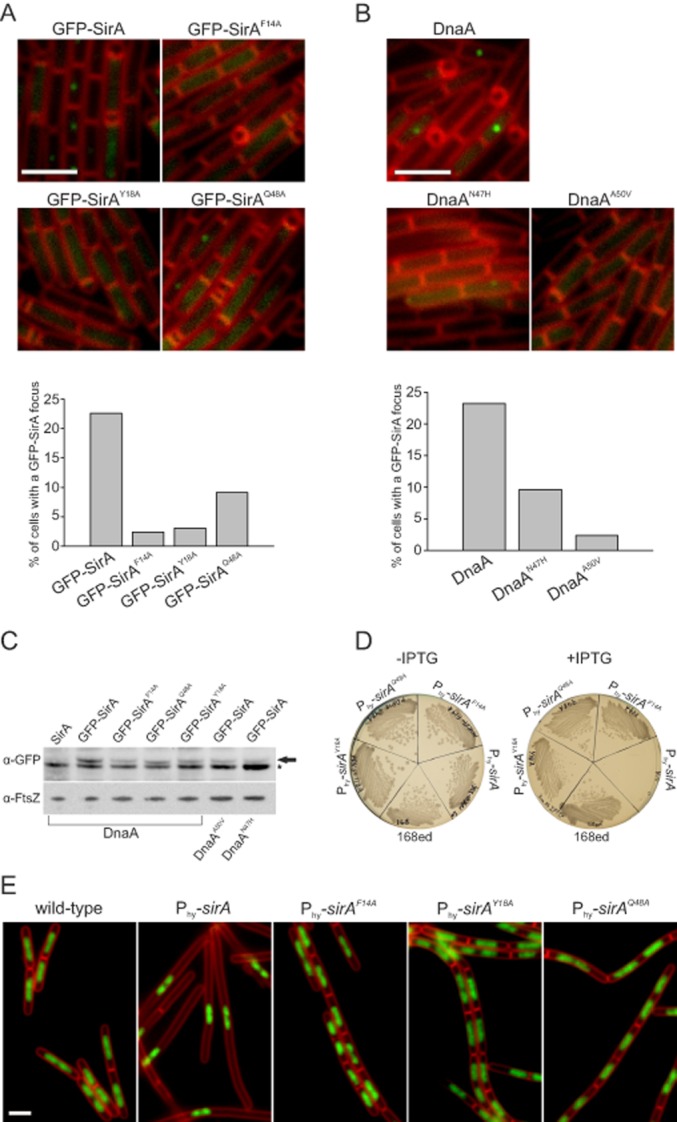
Examination of the SirA–DnaA interface in vivo.
A. Amino acid substitutions in SirA inhibit GFP–SirA foci formation. For each strain over 700 cells were analysed and the experiment was repeated at least three times. Quantification of a representative dataset is shown below. Scale bar = 3 μm. gfp–sirA (NR3); gfp–sirAF14A (NR130); gfp–sirAY18A (NR156); gfp–sirAQ48A (NR131).
B. Amino acid substitutions in DnaA inhibit GFP–SirA foci formation. For each strain over 700 cells were analysed and the experiment was repeated at least three times. Quantification of a representative dataset is shown below. Scale bar = 3 μm. gfp–sirA (NR3); gfp–sirA dnaAA50V (NR5); gfp–sirA dnaAN47H (NR154).
C. Immunoblot analysis showing levels of GFP-tagged SirA proteins. Cell samples were taken 150 min post resuspension in starvation media. The arrow points to GFP–SirA, the star highlights a contaminating band. Immunoblot of FtsZ was utilized to standardize the amount of protein from different samples. Wild-type (168ed); gfp–sirA (NR3); gfp–sirAF14A (NR130); gfp–sirAY18A (NR156); gfp–sirAQ48A (NR131); gfp–sirA dnaAA50V (NR5); gfp–sirA dnaAN47H (NR154).
D. Wild-type and mutant sirA were placed under control of an IPTG-inducible promoter and streaked on nutrient agar plates in the presence and absence of IPTG (3 mM). Wild-type (168ed); Phyperspank-sirA (NR171); Phyperspank-sirAF14A (NR172); Phyperspank-sirAQ48A (NR173); Phyperspank-sirAY18A (NR174).
E. The effects of overexpressing various SirA proteins at the single cell level were studied by growing cells in liquid CH medium. The images were taken 180 min after induction of gene expression with IPTG (3 mM). Membrane dye FM5-95 was used to highlight the outlines of the cells, DAPI was used to stain the DNA. Scale bar = 3 μm. Wild-type (168ed); Phyperspank-sirA (NR171); Phyperspank-sirAF14A (NR172); Phyperspank-sirAQ48A (NR173); Phyperspank-sirAY18A (NR174).