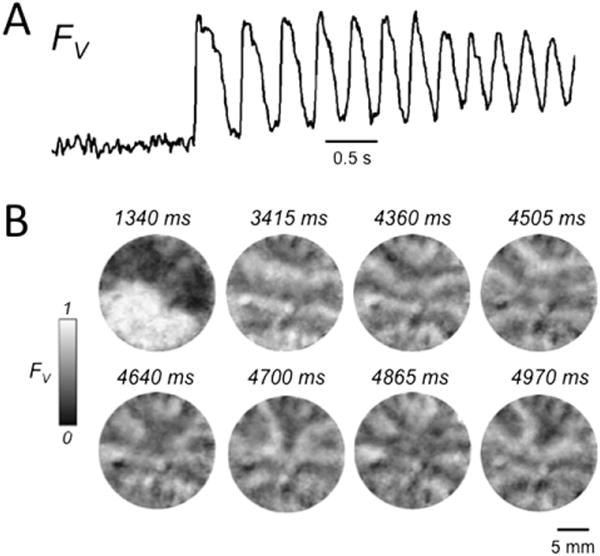
Figure 1.

Early afterdepolarization (EAD)-related arrhythmias induced by BayK4688 + isoproterenol in neonatal rat ventricular myocyte monolayers. A: Optical voltage trace (FV) illustrating a burst of EAD-mediated triggered activity following a paced beat. Note the incomplete repolarization between beats. B: Snapshots of voltage fluorescence (FV) at the times indicated following the paced beat at 1340 ms, revealing a complex pattern of wave fronts due to a mixture of focal activity and reentry. FV is shown on a gray scale, with 0 = maximally repolarized (<−70 mV) and 1 = maximally depolarized (>0 mV), on the basis of our previously reported patch electrode recording estimates.19
