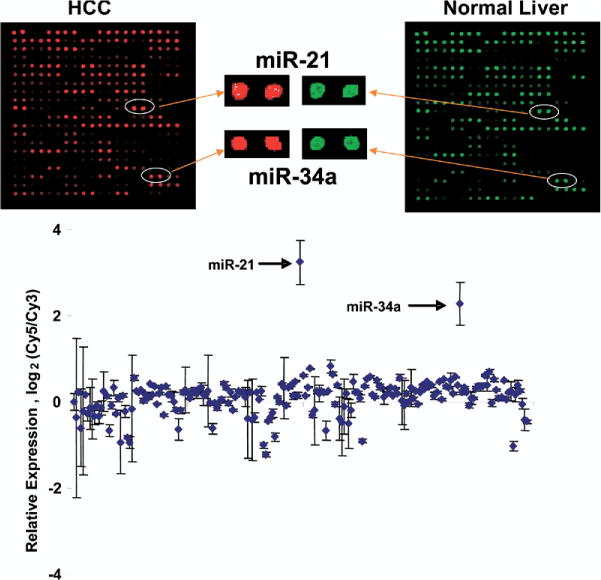
Figure 1.

miRNA expression profiles in human malignant and nonmalignant liver tissues and cells. miRNA was isolated and profiling was performed as described in the Materials and Methods section by hybridization to miRNA-specific probes on epoxy-coated slides. Samples from normal liver tissues were labeled with Cy3, whereas HCC tumor samples were labeled with Cy5 (n = 8). Representative chip images and spots for selected miRNA that have increased expression are illustrated. The data in the bottom panel represent the average ± standard errors of the log2 of the ratios of Cy5/Cy3 fluorescence intensity for each specific miRNA.
