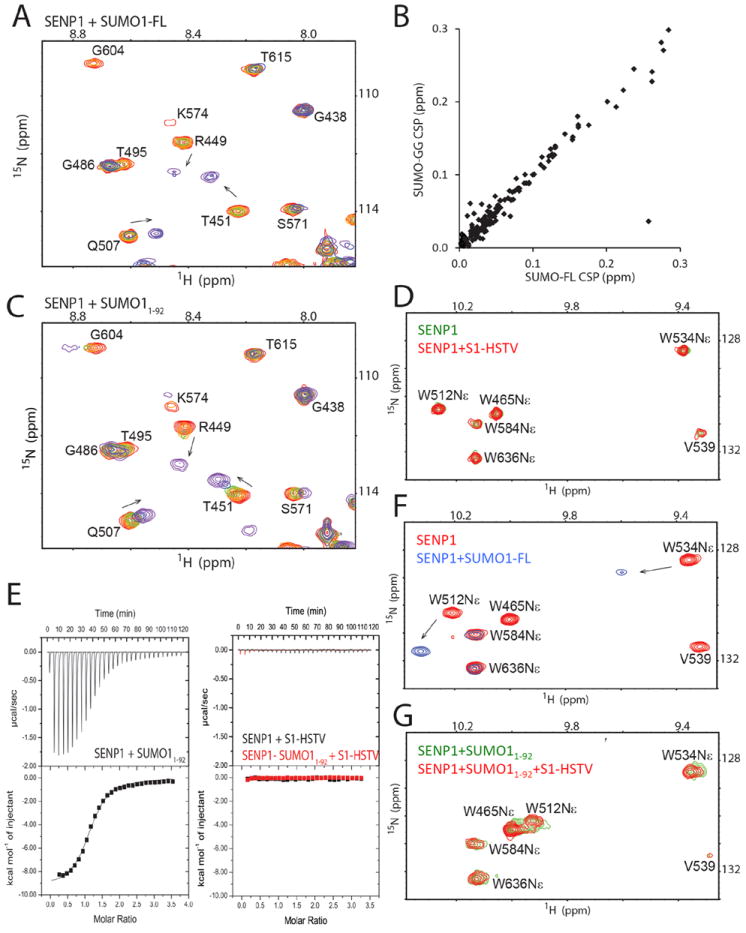
Fig. 2.

Characterization of the binding of SUMO1 constructs to SENP1. (A) Representative region of the superimposed 1H-15N HSQC spectra for monitoring the titration of SENP1 with SUMO1-FL. Spectra are colored as a rainbow from red to violet, corresponding to increasing SENP1:SUMO1 molar ratios (1:0, 1:0.2, 1:0.4, 1:0.6, 1:0.8, 1:1.07, and 1:1.39). Arrows indicate the direction of CSP. (B) Correlation of CSP of SENP1 upon binding SUMO1-GG and SUMO1-FL at a SENP1:SUMO1 molar ratio of 1:1.39. (C) The same region as shown in (A) but of the superimposed 1H-15N HSQC spectra monitoring the titration of SENP1 with SUMO11-92. (D) Overlay of the 1H-15N HSQC spectra of SENP1, free (green) and in the presence of a 2.4-fold higher concentration of the S1-HSTV peptide (red). (E) ITC profiles of SENP1 titration with SUMO11-92 (left), or the S1-HSTV peptide (right, black) that is superimposed onto the profile of S1-HSTV titration into the SENP1-SUMO11-92 complex (right, red). (F) Overlay of a region of the 1H-15N HSQC spectra showing the resonances of Trp sidechains of SENP1 free (red) and in complex with SUMO1-FL (blue). (G) Overlay of the same region of the 1H-15N HSQC spectra as that in (D) and (F) of the SENP1-SUMO11-92 complex (green), and that in the presence of a 2.7-fold higher concentration of S1-HSTV (red).
