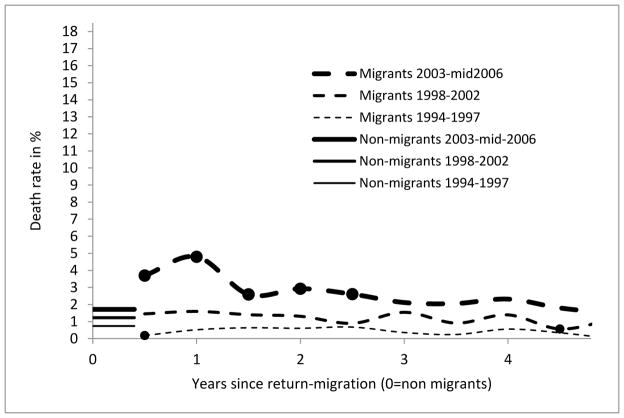
Figure 2. Death rates of adult females (18+) by duration of residence, Agincourt sub-district, South Africa (1994–2006).
Straight lines starting at year 0 refer to non-migrant females who never lived outside of the sub-district for more than 6 months a year for a period of 6 years or more. Broken lines denote in-migrant mortality with thicker lines showing more recent periods; and with dots showing where the death rate of migrants differed significantly (p>0.05) from non-migrant for the same period.

