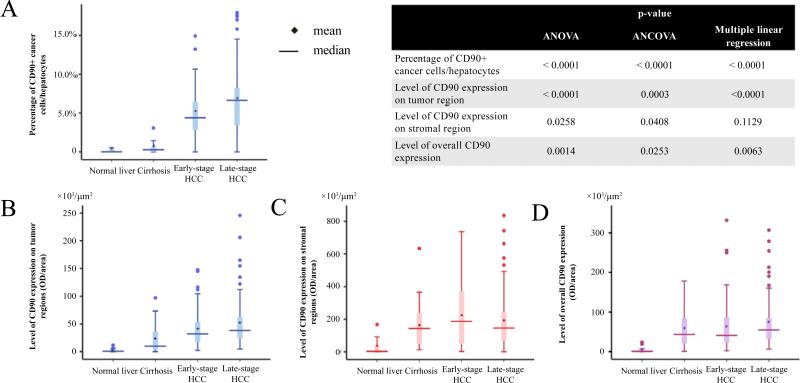
Figure 4. Boxplots represent changes of CD90 expression during hepatocarcinogenesis.
(A) Percentage of CD90 cancer cells/hepatocytes, (B) level of CD90 expression in tumor region, and (D) level of overall expression increased significantly during disease progression.
(C) Though levels of CD90 expression in stroma were significantly different among different disease categories, they did not show an increasing trend during heptocarcinogenesis.
(Normal n=15, Cirrhosis n=21, Early-stage HCC n=67, Late-stage HCC n=82)
Inserted table: ‘multiple linear regression’ refers to the analysis where the group is treated as an ordinal variable; ‘ANCOVA’ (analysis of covariance) refers to the adjusted analysis where the group is treated as categorical variable.

