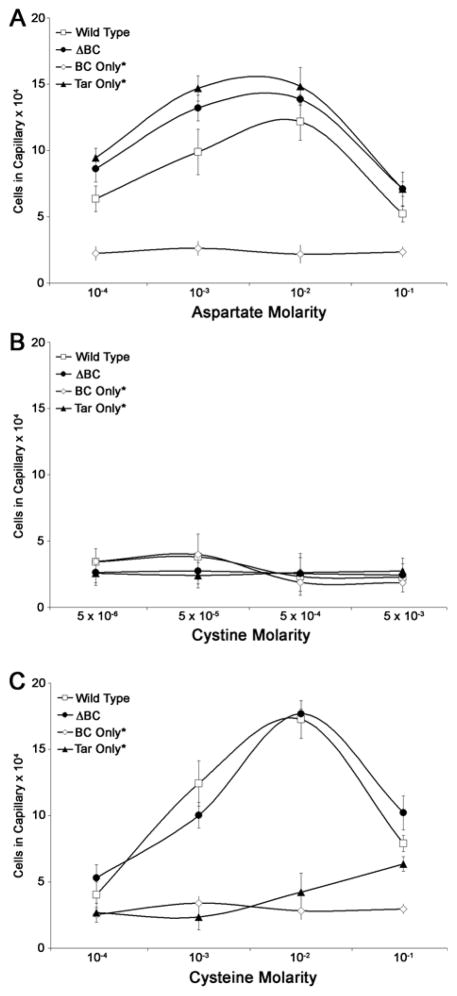
Fig. 2.
Quantification of the cystine response with capillary assays. The response of WT (14028), BC only* (JW20), ΔBC (SM542) and Tar only* (SM469) strains was monitored with (A) aspartic acid, (B) cystine, and (C) cysteine. The cell numbers are an average of three technical repeats of the experiment. Error bars are standard deviation from the mean. See Experimental Procedures for assay conditions.

