
FIG. 4.
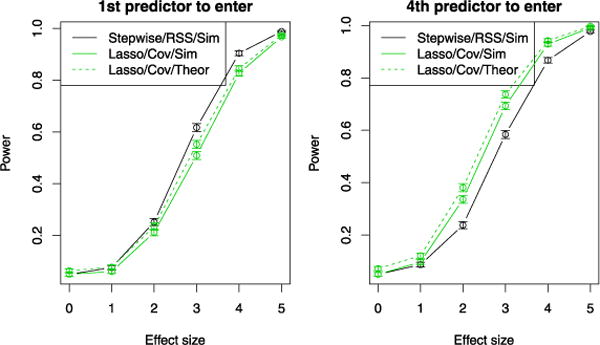
Estimated power curves for significance tests using forward stepwise regression and the drop in RSS statistic, as well as the lasso and the covariance statistic. The results are averaged over 1000 simulations with n = 100 and p = 10 predictors drawn i.i.d. from N(0, 1) and σ2 = 1. On the left, there is one truly nonzero regression coefficient, and we varied its magnitude (the effect size parameter on the x-axis). We examined the first step of the forward stepwise and lasso procedures. On the right, in addition to a nonzero coefficient with varying effect size (on the x-axis), there are 3 additional large coefficients in the true model. We examined the 4th step in forward stepwise and the lasso, after the 3 strong variables have been entered. For the power curves in both panels, we use simulation-based cutpoints for forward stepwise to control the type I error at the 5% level; for the lasso we do the same, but also display the results for the theoretically-based [Exp(1)] cutpoint. Note that in practice, simulation-based cutpoints would not typically be available.