
FIG. 8.
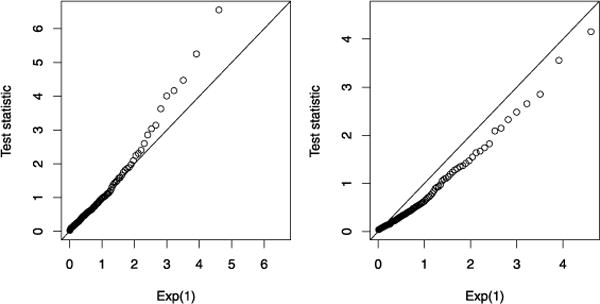
Lasso logistic regression: an example with n = 100 and p = 10 predictors, i.i.d. from N(0, 1). In the left panel, all true coefficients are zero; on the right, the first coefficient is large, and the rest are zero. Shown are quantile–quantile plots of the covariance test statistic (at the first and second steps, resp.), generated over 500 data sets, versus its conjectured asymptotic distribution, Exp(1).