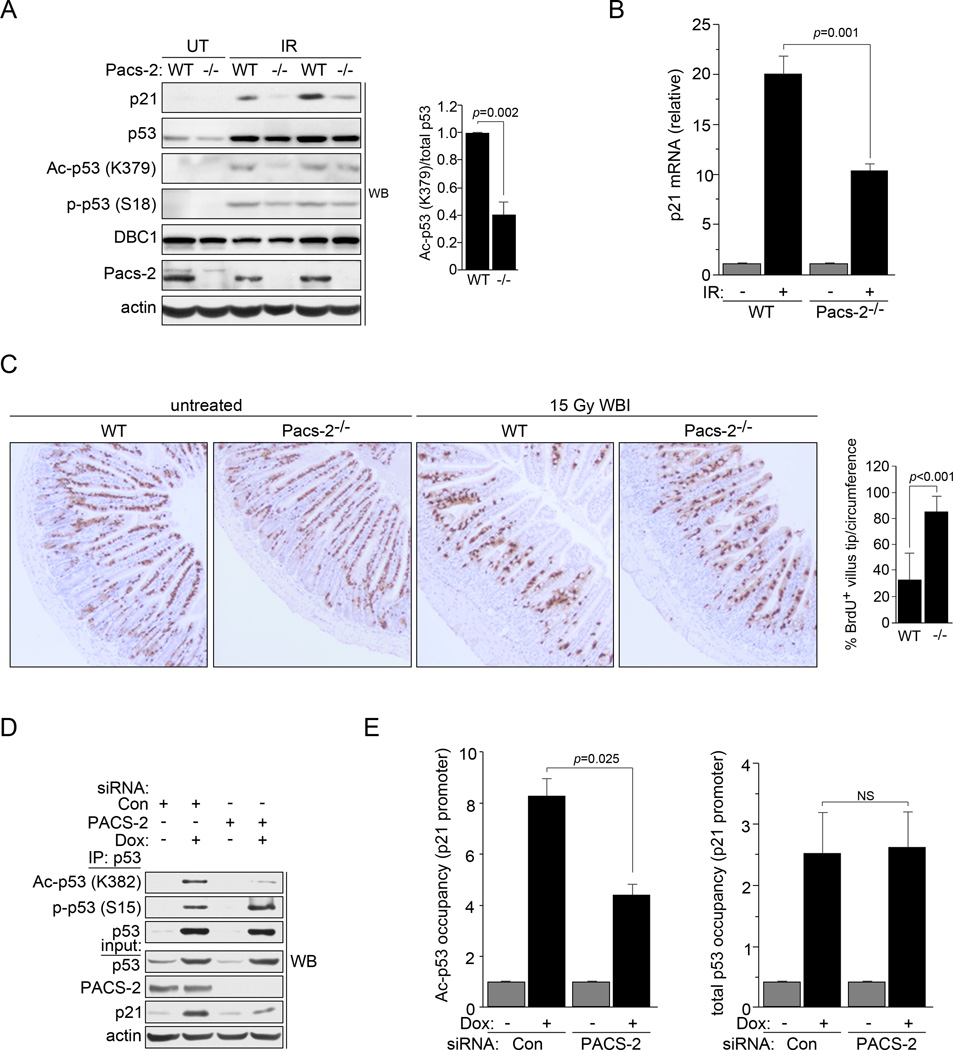
Figure 2. PACS-2 modulates p53 acetylation in vivo following DNA damage.
(A) Left: Thymuses from WT and Pacs-2−/− (−/−) mice exposed or not to 4.5 Gy IR (6hr) were analyzed by western blot. Right: Ac-p53 (K379) and total p53 were quantified using NIH Image J from IR-exposed WT or Pacs-2−/− mice. (B) Thymuses from WT and Pacs-2−/− mice exposed to 4.5 Gy IR (6hr) as indicated were analyzed for p21 induction by qRT-PCR (normalized to GAPDH). Error bars represent mean ± SEM from ≥ 4 mice per condition. Statistical significance determined using Student’s t-test. (C) Left: Small intestines from WT and Pacs-2−/− (−/−) mice were analyzed by IHC for BrdU 48hr following labeling and exposure to 15 Gy WBI as indicated. Right: Percentage of BrdU+ cells reaching the upper 1/4th of the villus tips per circumference was quantified. Error bars represent mean ± SD. Statistical significance determined using Student’s t-test. Quantification from untreated mice was not determined as all villus tips from these mice contained BrdU+ cells. (D) p53 was immunoprecipitated from Control (Con) or PACS-2 siRNA-treated HCT116 cells were treated with 0.5 µM Dox and analyzed by western blot. (E) Control (Con) or PACS-2 siRNA-treated HCT116 cells treated with 0.5 µM Dox (6hr) were analyzed by ChIP qPCR for the p21 promoter using antibodies specific for total p53 (DO-1) or Ac-p53 (K382). Error bars represent mean ± SEM from 3 independent experiments. Statistical significance determined using Student’s t-test. NS, not significant. See also Figure S3.

