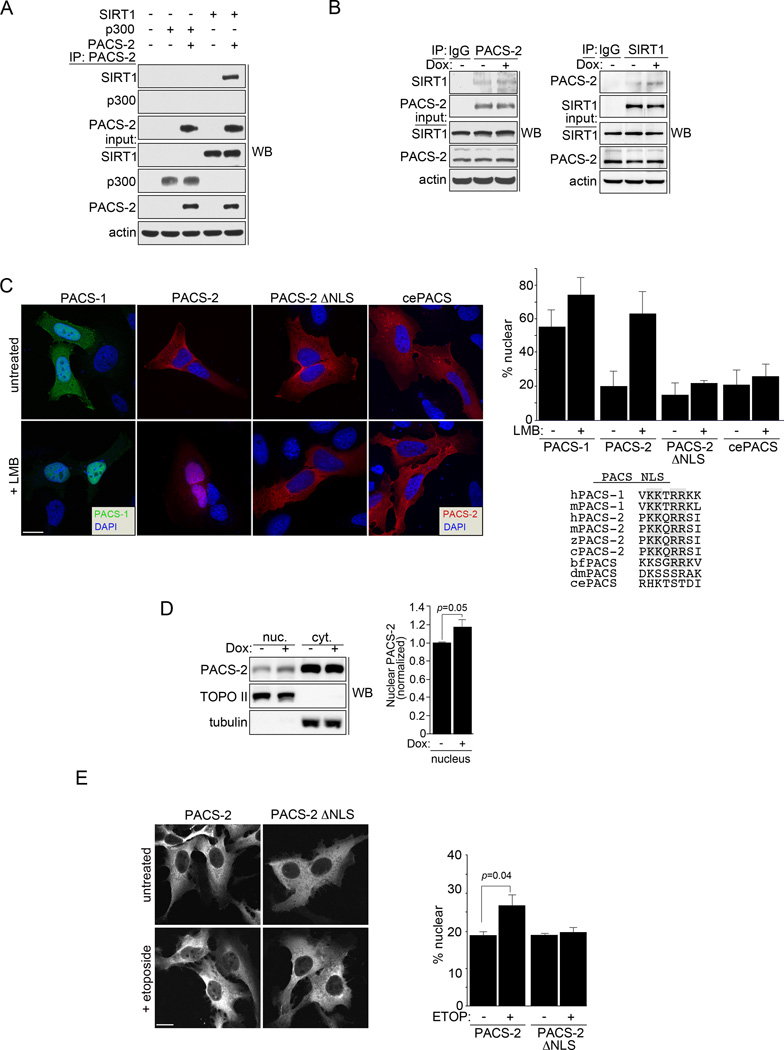
Figure 3. PACS-2 interacts with SIRT1 in the nucleus.
(A) PACS-2-FLAG was immunoprecipitated from HCT116 cells and co-precipitating SIRT1-V5 or p300-HA was detected by western blot. (B) HCT116 cells treated with 0.5 µM Dox (3hr) as indicated were immunoprecipitated with control IgG, anti-PACS-2 (top) or anti-SIRT1 (bottom) and co-precipitating SIRT1 (top) or PACS-2 (bottom) detected by western blot. (C) Left: U2OS cells expressing eGFP-PACS-1, mCherry-PACS-2, mCherry-PACS-2ΔNLS or mcherry C. elegans PACS (T18H9.7a) were treated with 40 nM LMB (3hr) and analyzed by deconvolution microscopy. Nuclei were stained with DAPI. Top right: Percent total cellular fluorescent protein signal in the nucleus was quantified. Error bars represent mean ± SD from >100 cells in 3 independent experiments. Bottom right: Alignment of the predicted NLS motif (https://www.predictprotein.org) fitting the consensus [PLV]K[RK]x[RK][RK][RK][PL] from human PACS-1 (sp|Q6VY07, gi|30089916) with human PACS-2 (sp|Q86VP3, gi|155029546), mouse PACS-1 (gi|54291704), mouse PACS-2 (kkqrrsiv, gi|124487181), chicken PACS-2 (gi|513196172), zebrafish PACS-2 (gi|170172595), amphioxous PACS (gi|229298623), Drosophila PACS (Krt95D, gi|24649488) and C. elegans PACS (T18H9.7a, gi|373219078). Consensus basic amino acid doublets are shaded. (D) HCT116 cells were treated or not with 0.5 µM Dox for 6 hr. PACS-2 in the nuclear and cytoplasmic fractions was detected by western blot. Error bars represent mean ± SD from 3 independent experiments. Statistical significance was determined using Student’s t-test. (E) U2OS cells expressing mCherry-PACS-2 or mCherry-PACS-2ΔNLS were treated with 100 µM Etoposide (3hr) and analyzed by confocal microscopy. Nuclei stained with DAPI. Bottom: Percent total cellular fluorescent protein signal in the nucleus was quantified. Error bars represent mean ± SD from >100 cells in 3 independent experiments. Scale bar, 10 µm.

