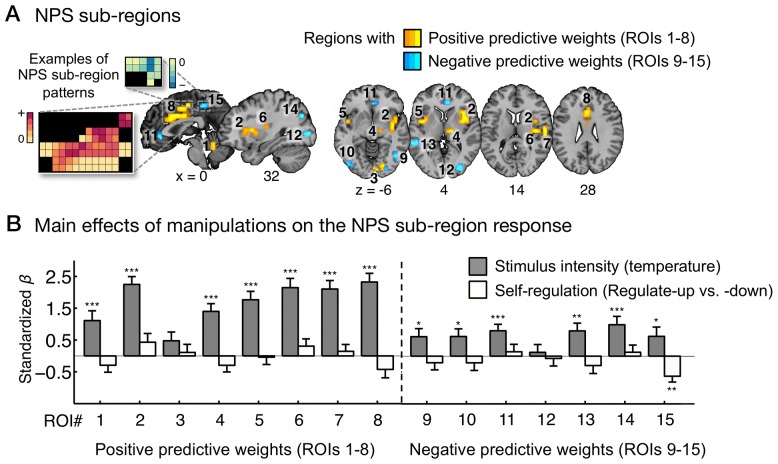
Figure 2. The effects of stimulus intensity and self-regulation on separate sub-regions within the neurologic pain signature.
(A) NPS sub-regions: ROIs 1–8 are regions with positive NPS weights, and ROIs 9–15 are regions with negative NPS weights. We obtained these regions from the FDR (q<0.05) thresholded NPS map (see Figure 1B) smoothed with a 0.5 mm Gaussian kernel. Some examples of weight patterns within the NPS sub-regions are presented in the insets; small squares indicate voxel weights, and black squares indicate empty voxels located outside of the ROIs. (B) The main effects of stimulus intensity and self-regulation on the NPS response within sub-regions. y-Axis represents standardized regression coefficients from multilevel generalized linear models with stimulus intensity and self-regulation (regulate-up versus -down) as predictors and NPS response as dependent variables. Error bars represent standard errors of the mean (SEM). The data used to generate the plots can be found in Table S2. ***p<0.001; **p<0.01; *p<0.05, two-tailed.

