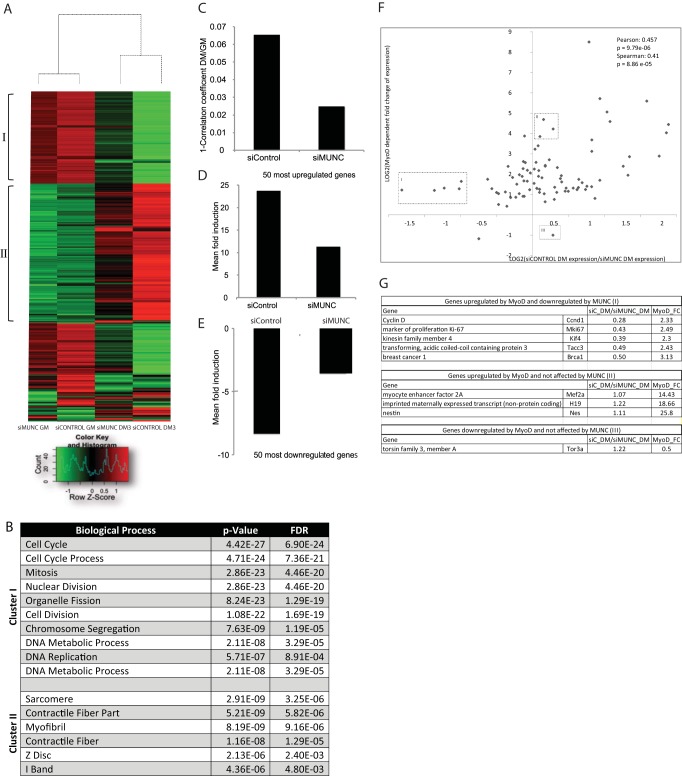
FIG 7.
Global gene expression changes that occur during skeletal myogenesis are inhibited by MUNC depletion. (A) Hierarchical clustering of the 400 genes that varied the most upon differentiation of C2C12 cells. The cells were treated with either MUNC or control silencer RNAs in both GM and DM. Signals are scaled to Z scores of the rows. I and II, clusters I and II, respectively. (B) Clusters I and II represent genes that are enriched in GO terms associated with cell cycle and growth (I) and with muscle-specific processes (II). (C) Deviation from a perfect correlation coefficient of 1 of gene expression profiles of GM versus DM3 cells with either siControl or siMUNC as measured by the Affymetrix exon array analysis. (D and E) Mean expression fold change of the 50 most upregulated or downregulated genes in control differentiating cells. This fold change is suppressed in siMUNC cells. Values are means ± standard errors of the means (n = 5). (F) Values on the y axis represent fold change of genes known to be induced (top) or repressed (bottom) by MyoD (25). Values on the x axis represent the fold change of the same genes after knockdown of MUNC (left, repressed by MUNC; right, induced by MUNC). Boxes represent the following: I, genes induced by MyoD but downregulated by MUNC; II, genes induced by MyoD but not regulated by MUNC; III, genes downregulated by MyoD but not affected by MUNC. (G) Description of the genes belonging to the three subclasses (boxes I to III) identified in panel F. FDR, false discovery rate.

