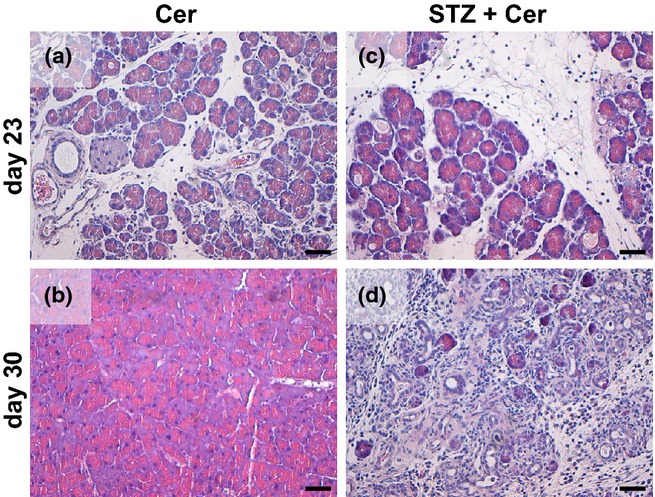
Figure 4.

Histology of the pancreas after induction of acute pancreatitis. Representative images of hematoxylin/eosin-stained pancreas sections of cerulein (a, b) or STZ plus cerulein (c, d)-treated mice on day 23 (a, c) and day 30 (b, d). Bar = 50 μm.
