
Figure 2.
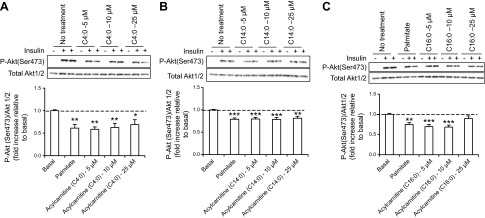
Acylcarnitine treatments result in insulin resistance at the level of Akt phosphorylation in C2C12 myotubes. A–C) Top panel: representative Western blot of p-Akt (Ser473) expression in C2C12 myotubes. Bottom panel: quantification by density analysis of fold increase in p-Akt (Ser473) relative to basal. C2C12 myotubes were pretreated for 18 h with 750 μmol/L palmitate or 5, 10, or 25 μmol/L (A) C4:0, (B) C14:0, or (C) C16:0 acylcarnitine. p-Akt was calculated relative to total Akt 1/2, and results are expressed as fold of insulin-stimulation of p-Akt in vehicle controls. Akt 1/2 is shown as a loading control. *P < 0.05, **P < 0.01, ***P < 0.001, treated cells vs. basal. Data are shown as mean ± sem.