Figure 5.
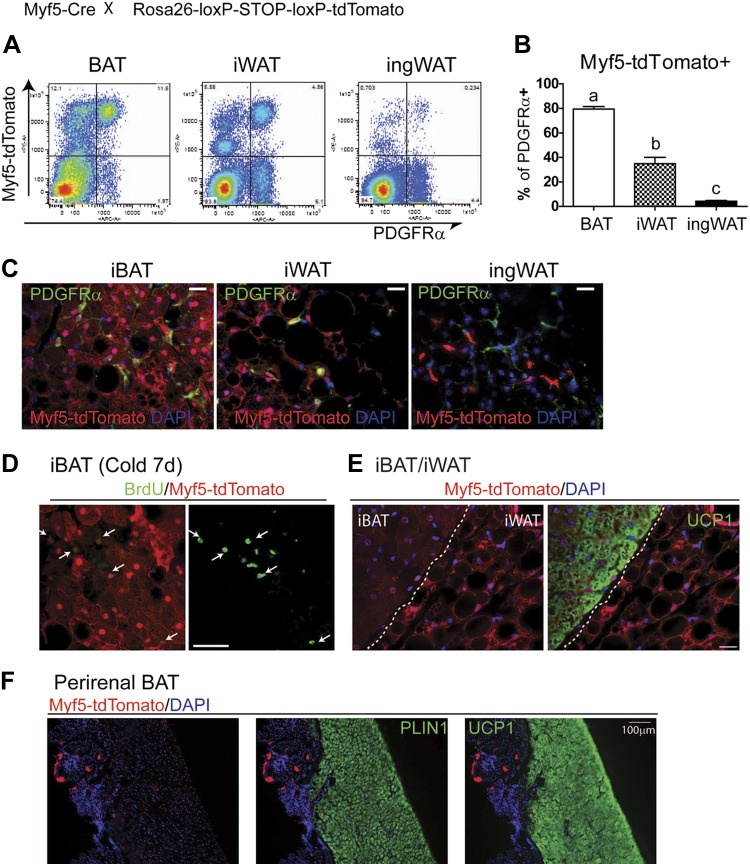
Lineage tracing of Myf5-derived cells in various adipose tissue depots. A and B) Flow cytometric analysis of contribution of Myf5+ lineage-derived cells to PDGFRα expressing cells in iBAT, iWAT, and ingWAT from Myf5Cre/Rosa26-loxP-STOP-loxP-tdTomato mice (n = 3). Significant differences (P < 0.001) are indicated by different letters (a, b, and c). C) Representative images of cryosections of iBAT, iWAT, and ingWAT of Myf5Cre/Rosa26-loxP-STOP-loxP-tdTomato mice stained for PDGFRα. D and E) Cryosections of BAT and WAT from Myf5Cre/Rosa26-loxP-STOP-loxP-tdTomato mice. D) New BAs labeled by BrdU were positive for previous Myf5 expression 7 d after cold exposure. E) Uniform Myf5 reporter (tdTomato) expression in UCP1+ BAs in iBAT and UCP1− white adipocytes in adjacent iWAT. F) Absence of Myf5 reporter expression in most UCP1+ BAs in perirenal adipose tissue. Scale bars, 20 µm.

