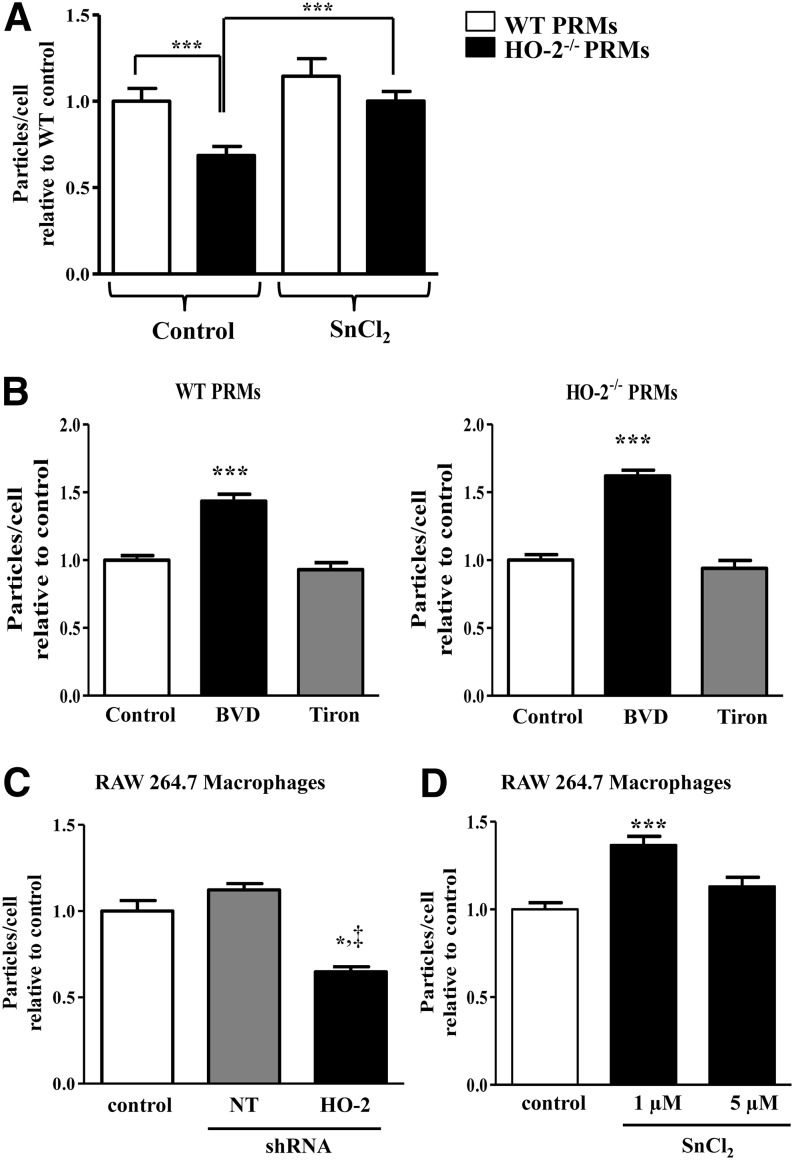
Figure 2.
Effect of HO-2 deficiency on macrophage phagocytosis. A) Number of Zymosan particles per cell relative to WT control with and without SnCl2 (1 µM) preincubation. Results are the mean ± sem; n = 2–4. ***P < 0.001. White bars, WT; black bars, HO-2−/− cells. B) Number of Zymosan particles per cell relative to vehicle control with and without biliverdin (BVD; 10 µM) or Tiron (1 mM) preincubation. Results are the mean ± sem; n = 1–3. ***P < 0.001. White bars, vehicle control cells; black bars, biliverdin-treated cells; gray bars, Tiron-treated cells. C) Number of Zymosan particles per cell relative to control. Results are the mean ± sem; n = 3. *P < 0.05 for HO-2 shRNA-treated (black bar) from control (white bar); ‡P < 0.05 for nontarget shRNA (gray bar). D) Number of Zymosan particles per cell relative to vehicle control with and without SnCl2 (1 or 5 µM) preincubation. Results are the mean ± sem; n = 2–3. ***P < 0.05 for SnCl2 1 µM treated (black bar) from vehicle control (white bar).

