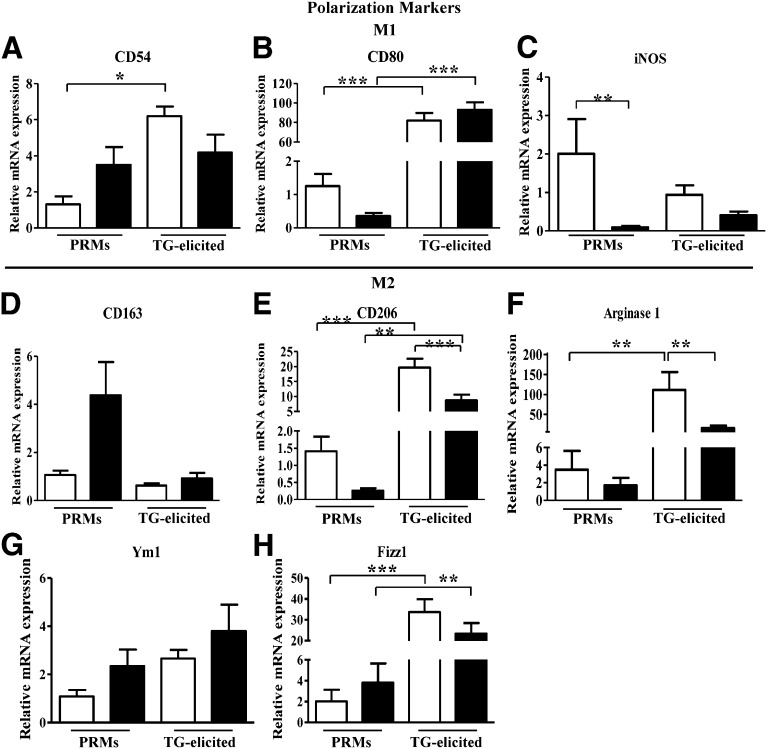
Figure 4.
Real-time PCR analysis of mRNA expression of macrophage M1-M2 polarization associated genes. A) CD54, B) CD80, C) iNOS, D) arginase 1, E) CD206, F) CD163, G) Ym1, and H) Fizz1 in PRMs and TG-elicited peritoneal macrophages isolated from WT (white bars) and HO-2−/− (black bars) mice. Results are presented as mRNA expression relative to WT PRMs and are the mean ± sem; n = 4–10. *P < 0.05, **P < 0.01, and ***P < 0.001 from WT PRMs (i.e., nonelicited macrophages).

