FIGURE 3.

Imaging through optical windows
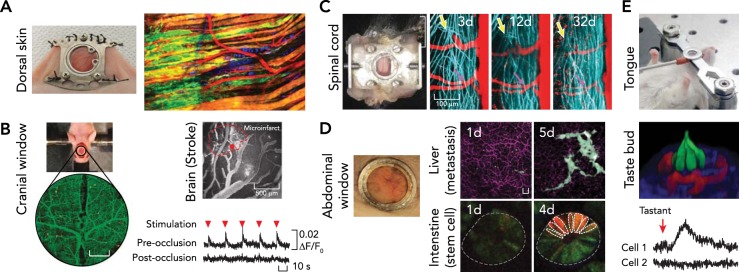
A: dorsal skin. The photograph at left shows a dorsal skinfold chamber implanted on a nude mouse. The fluorescent image at right shows collective invasion of melanoma cells taken by multi-photon microscopy in the dorsal skinfold chamber. Images were reproduced from Ref. 74a with permission. B: brain. The photograph shows cranial window model implanted on a nude mouse after craniotomy. Change in neuronal responsiveness to limb stimulation (red arrowhead) after laser-induced microinfarct. Images reproduced from Ref. 99 with permission. C: spinal cord. The photograph at left shows imaging chamber implanted for chronic imaging of the spinal cord. Regeneration dynamics of the spinal axons (blue) at the injured area (yellow arrow) was traced over a month. Images reproduced from Ref. 29 with permission. D: abdominal organs. Glass window implanted on the abdomen (left) enabled tracking of cellular dynamics in various abdominal organs over time, such as cancer metastasis in the liver (top) and stem cell dynamics in small intestine (bottom). Scale bar, 20 μm. Images reproduced from Refs. 89–91 with permission. E: tongue. Top: preparation for imaging the mouse tongue. The fluorescence image (middle) shows a three-dimensional view of a taste bud (red, blood vessel; green, taste receptor cells). Bottom: intracellular calcium activity measured in the taste receptor cells after introducing artificial sweetener intravenously. Images reproduced with permission from unpublished observations of Choi M, Lee WM, Yun SH.
