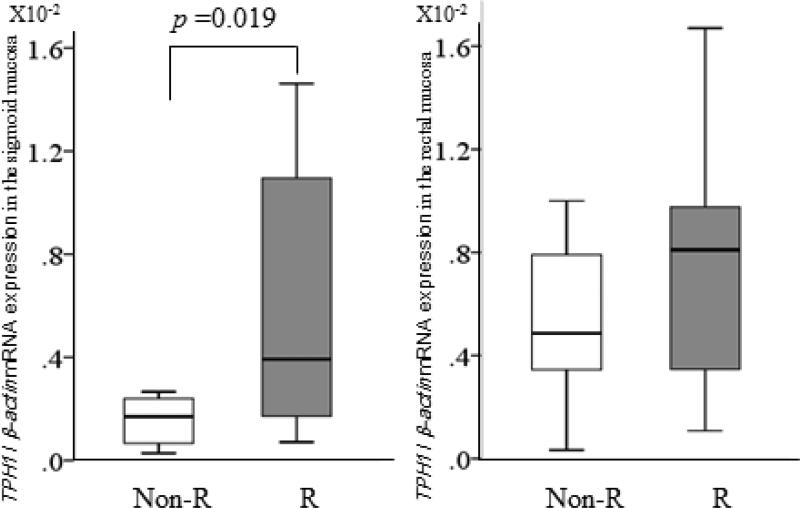
Figure 2.
Comparisons of baseline relative expressions of TPH 1 mRNA between the ramosetron non-responders group (light bars) and the responders group (dark bars). Horizontal bar= median; Box=25th-75th interquartile range; Vertical lines= range of values. The cycle passing threshold (Ct) was recorded for each mRNA, and β-actin was used as the endogenous control for data normalization. p Values were calculated using the nonparametric Mann-Whitney U test between the two groups.

