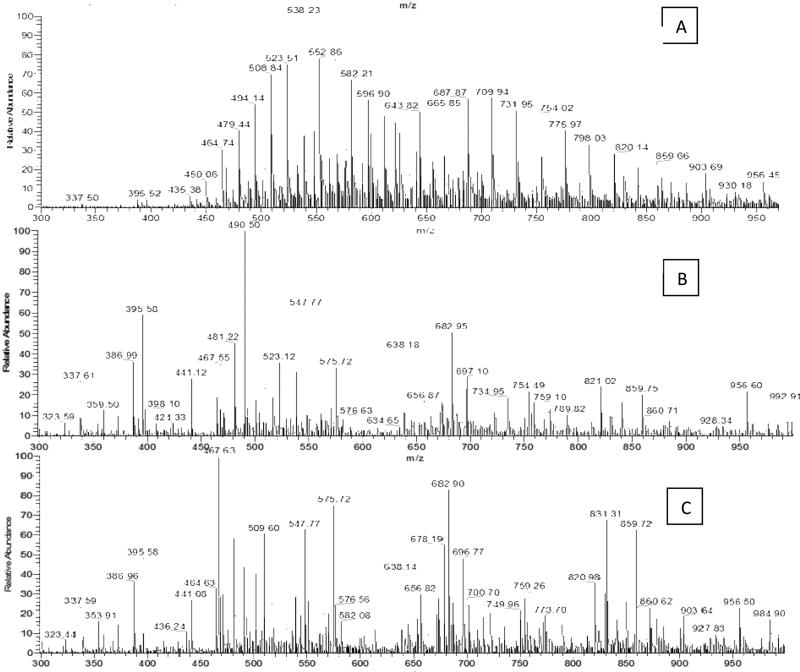
Figure 2.
Mass spectrometric detection of the tryptic peptides from HSA with and without OCT. A) A representative ESI spectrum of the tryptic peptides from OCT-contaminated HSA digested in solution. B) A representative ESI spectrum of OCT-contaminated HSA after OCT removal using CIPPE. C) A representative ESI spectrum of clean HSA digested in solution.

