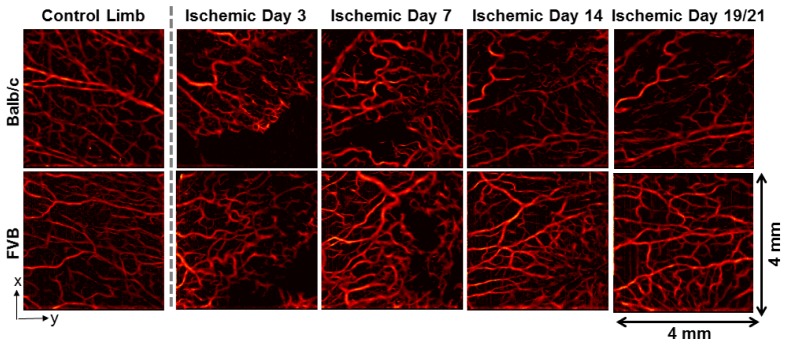
Fig. 3.

Representative speckle variance OCT images of the adductor muscle from each mouse strain, including the contralateral control limb (far left) and the ischemic limb imaged non-invasively over a time-course. Images are shown for both Balb/c (top row) and FVB (bottom row) mice. The last imaging time point was day 19 for Balb/c mice and day 21 for FVB mice.
