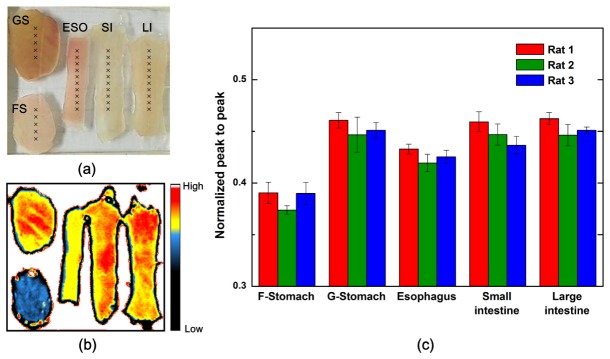
Fig. 2.

(a) Optical photograph of five GI tract samples from a rat model. (b) Reflected 2D THz image with peak-to-peak values. (c) Normalized and averaged reflection peak-to-peak values for five GI tract tissues (from three different rats) analyzed at points marked in (a).
