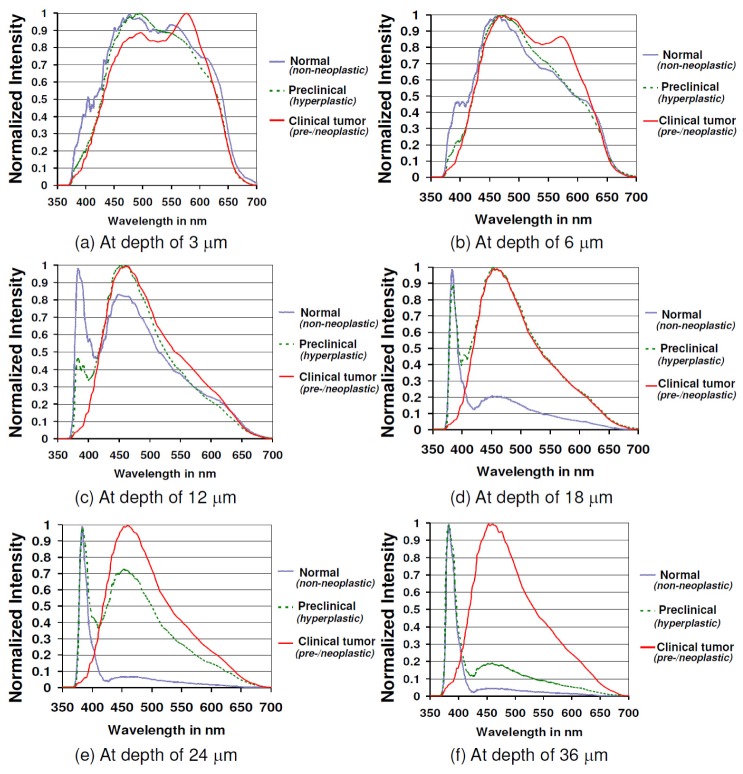
Fig. 6.
Normalized emission spectra for normal mice skin (y = 17, s = 17, n = 12), skin with preclinical hyperplasia (y = 8, s = 8, n = 6) and clinically visible skin tumors (y = 7, s = 7, n = 6) at depths of (a) 3 μm, (b) 6 μm, (c) 12 μm, (d) 18 μm, (e) 24 μm and (f) 36 μm from skin surface. The depicted spectrum is an average of the emission spectra obtained at the corresponding depth from ‘y’ transverse x-y NLSI scans (100 μm × 100 μm) in ‘s’ regions from ‘n’ mice for each clinico-pathologic grade.

