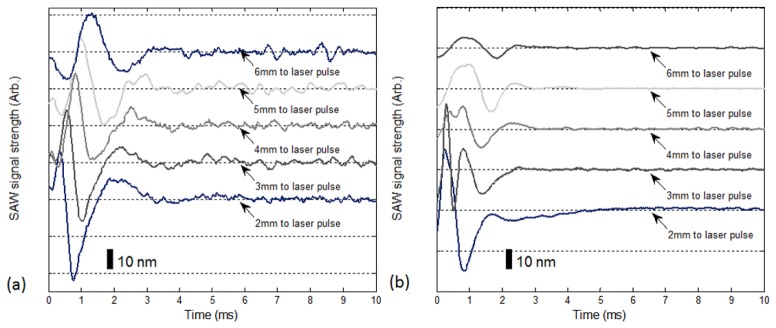
Fig. 3.

Typical laser-induced SAW recorded by PhS-OCT at the surface (a) via the serosal side of the bladder wall and (b) via the luminal side of the bladder wall. Each curve is shifted vertically by an equal distance to better illustrate the results captured at different positions. The horizontal dotted lines indicate the baseline. The bar indicates the estimated displacement of the surface wave. The similar dotted lines and bars also applies to Figs. 7 and 8.
