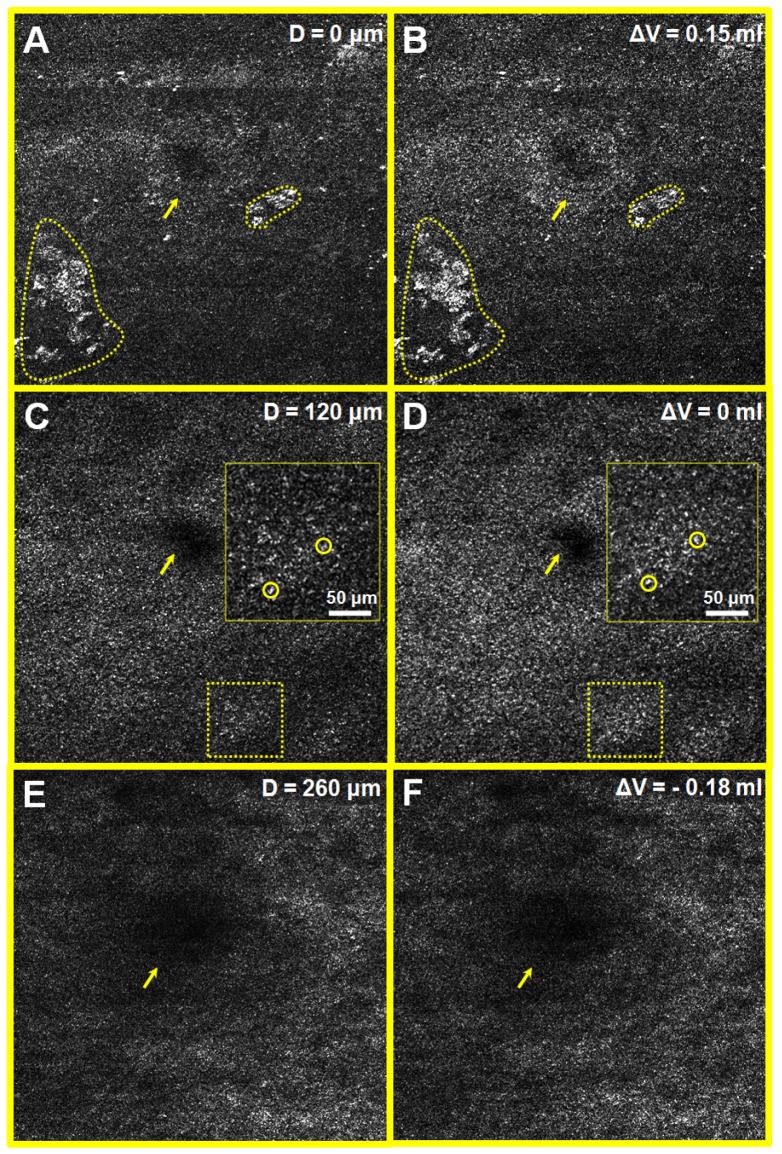
Fig. 7.
SECM images of swine esophageal tissue obtained at multiple imaging depths by axially translating the SECM optics (A, C and E) and by changing water volume in the vari-focal objective lens (B, D and F). dotted regions – reflection artifacts originated from scratches on the FEP slip; circles – basal cell nuclei; and arrows – papillae. Size of each image = 1250 μm × 1250 μm.

