
Fig. 7.
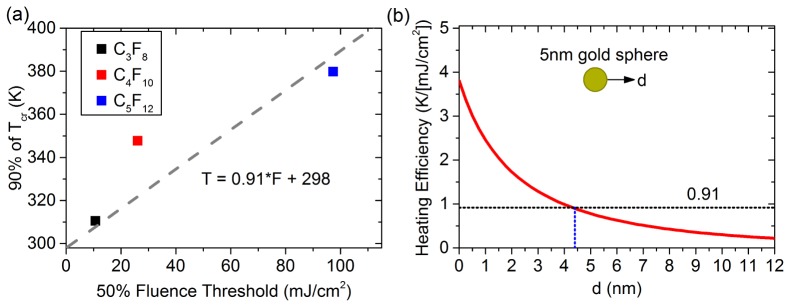
(a) The fluence to vaporize 50% of the droplets plotted against 90% of critical temperature. The gray dashed line is a linear fit to the data with a y-intercept set to 298 K. (b) The heating efficiency of a 5nm gold sphere surrounded by water is plotted as a function of the distance from gold-liquid interface. The black dotted line is the estimated heating efficiency from the experiments and the blue dotted line is the estimated length of the PEG brush layer.