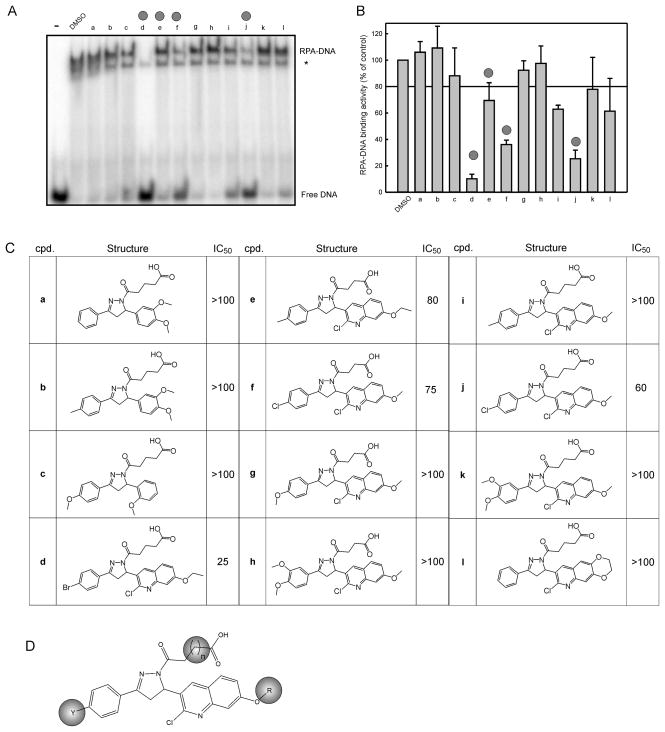
Figure 1. EMSA screening of TDRL-505 analogs.
A) 12 TDRL-505 analogs were screened using the EMSA assay for RPA-DNA inhibition activity at 100 μM. The free DNA and RPA-DNA complexes are indicated. The asterisk indicated the position of the E. coli SSB-DNA complex. B) Quantification of duplicate determinations were averaged and plotted as a percent of control with bars representing the range of values C) Structures of compounds with their corresponding IC50 values (μM) calculated from EMSA reactions as described in Methods. Compounds were titrated at a range of 1–125 μM. D) SAR identified areas of interest and they are highlighted by the colored ovals.

