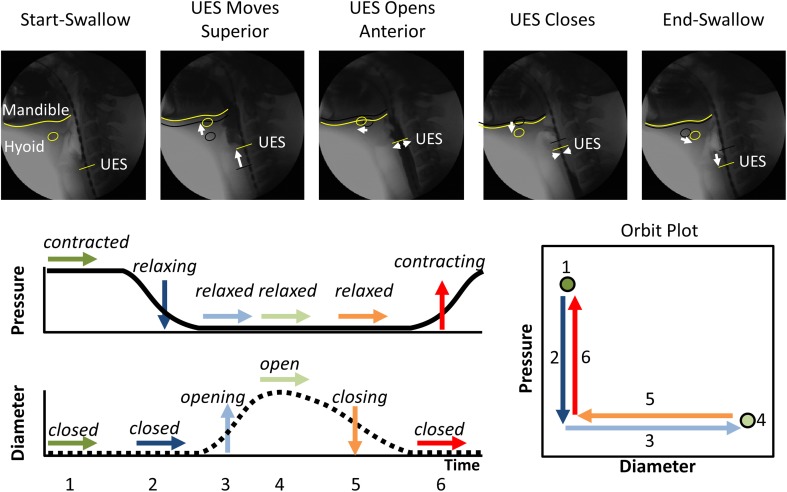
Figure 1.
The typical pattern of pressure and diameter change that the UES undergoes during normal swallowing. Videofluoroscopy images show the different phases of swallow. The position of the inferior edge of the mandible, the hyoid bone and the UES proximal margin are outlined in yellow in each frame. White arrows show movement of the relevant anatomical structures relative to their position from previous frame (shown as black shadow). A typical UES pressure profile is shown with arrows indicating periods when pressure is static (→), decreasing (↓) or increasing (↑). A typical diameter profile is shown with arrows indicating periods when the diameter is static (→), increasing (↑) or decreasing (↓). When the pressure and diameter data are interpreted together, different mechanical states can be defined based on the direction of pressure change and in relation to whether the lumen is open, closed or changing in diameter. The relationship of diameter vs. pressure over time can also be visualized by way of an “Orbit” plot. The mechanical states numbered 1–6 typify the normal sequence of UES contractility and UES opening during swallowing. Note: Nomenclature describing the states shown is provided in Figure 2.

