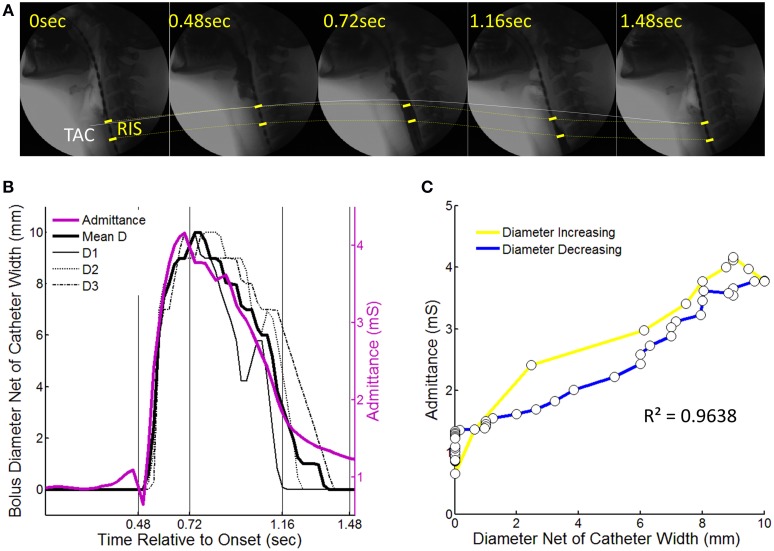
Figure 4.
An example of a 10 ml liquid swallow showing the temporal correlation of luminal diameter and intraluminal admittance at the level of the reference impedance segment (RIS). (A) Sequential images from swallow onset (laryngeal elevation) showing barium passing through the RIS. Dotted lines chart the trajectory of movement of the tracheal air column (TAC, white line) and the RIS (yellow dotted line). Note decoupling of the TAC and proximal margin of the RIS at time points 0.72 and 1.16 s after swallow onset. (B) Diameter of the barium contrast column and admittance measured at the level of RIS over time from swallow onset. Individual diameter curves are shown for locations D1–D3 (per Figure 3) as well as the mean diameter. (C) Time correlation of diameter and admittance with colors indicating whether samples correspond to when the lumen was increasing (yellow) or decreasing (blue) in diameter.

