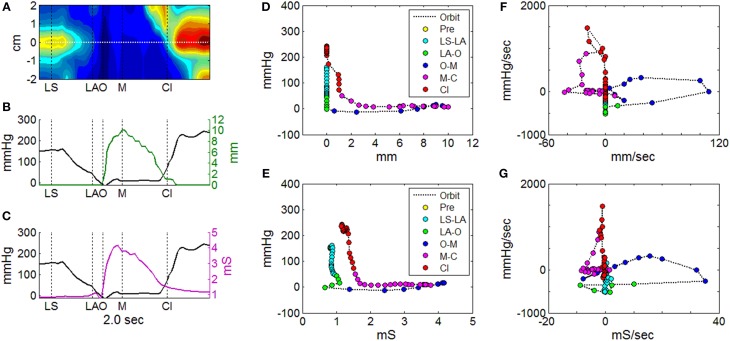
Figure 7.
Orbit plots to describe UES pressure and UES opening over the time of a single swallow. (A) Spatio-temporal plot of pressures recorded during UES relaxation and opening. Horizontal white line indicates the midpoint position of the reference impedance segment over which average diameter was calculated. Vertical black lines indicate timings of important radiological features; onset of laryngeal superior movement (LS), onset of laryngeal anterior movement (LA), onset of UES opening (O), maximum UES diameter (M), and UES closure (Cl). (B) Plot of pressure (at position 0 cm in A) and mean diameter (based on fluoroscopy) at the reference segment. (C) Plot of pressure (at position 0 cm in A) and admittance at the reference segment. (D) Orbit plot based on diameter vs. pressure data over time in (B), with samples color coded for order of time sequence. (E) Orbit plot based on admittance vs. pressure data over time in (C), with samples color coded for order of time sequence. (F) Time derivative orbit plot of diameter vs. pressure with samples color coded for time sequence. (G) Time derivative orbit plot of admittance vs. pressure with samples color coded for time sequence.

