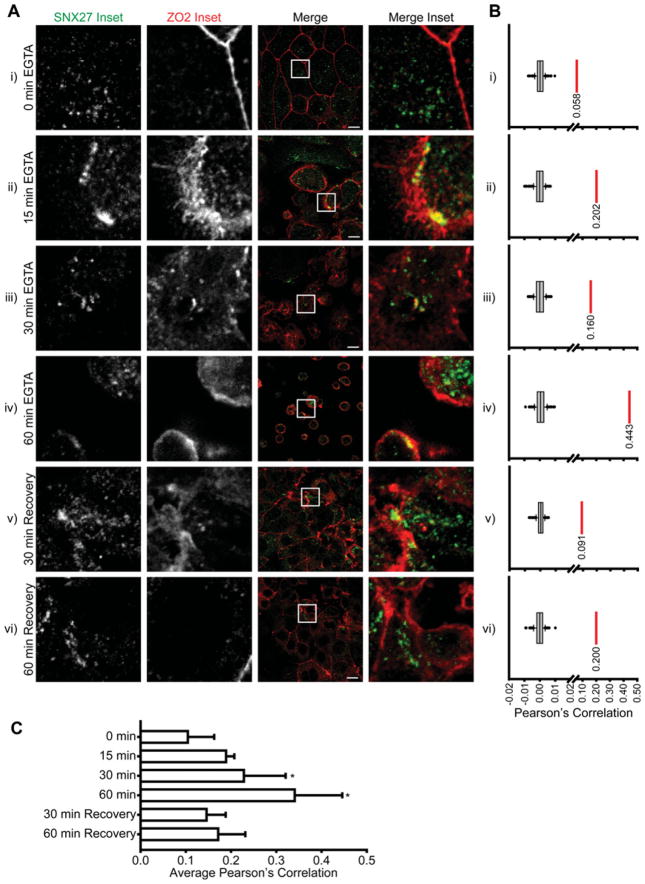
Figure 5. Co-localization of SNX27 and ZO-2 during TJ disruption.
(A) mpkCCD cells were grown to confluence, depleted of calcium using 2 mM EGTA and then returned to normal growth medium. During this process cells were fixed and permeabilized at the indicated time points and stained with an anti-SNX27 polyclonal or anti-ZO-2 monoclonal antibodies (scale bar = 10 μm). (B) For the corresponding representative images in (A) Costes’ randomization analysis was performed to determine co-localization. Box plot represents Pearson’s correlations for the ZO-2 channel compared with 200 randomized SNX27 channels. The red lines and values represent Pearson’s correlation of the corresponding image [%(R obs >R rand) = 100%]. (C) Average Pearson’s correlation of SNX27 and ZO-2 channels for images corresponding to indicated time points (0 min n = 11, 15 min n = 2, 30 min n = 7, 60 min n = 6, 30 min recovery n = 10 and 60 min recovery n = 7). *ANOVA P < 0.001. Error bars represent the S.D.

