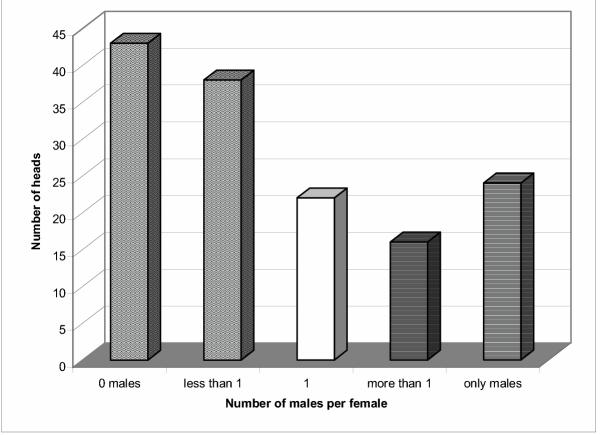
Figure 2.
Number of male lice per female louse per head. The columns show the frequency with which on individual heads female lice were associated with no males, less than one male per female, equality, and more than one male per female. The boundaries of equality include one standard deviation (SD) on each side, the columns 'less than 1' and 'more than 1' are minus one SD.

