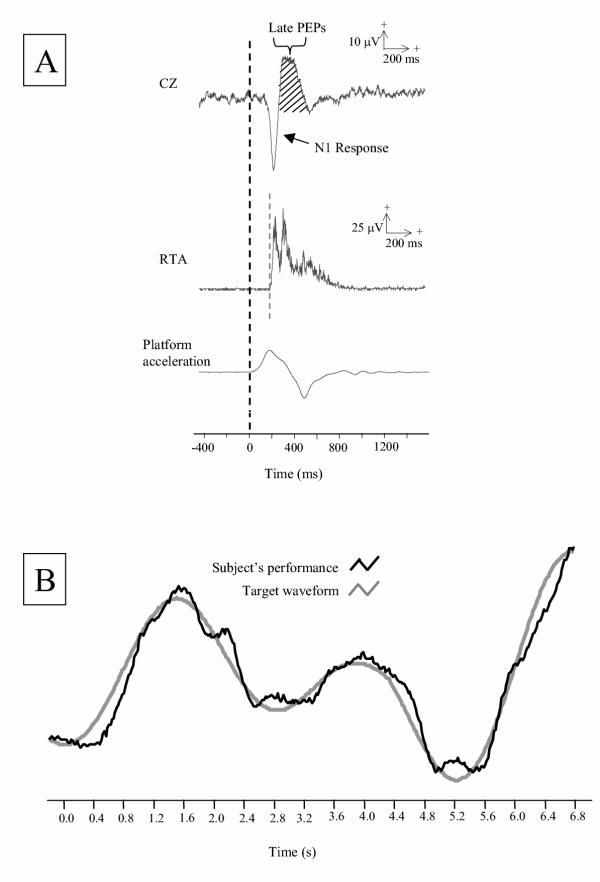
Figure 1.

A) Average cortical activity, electromyographic activity, and platform acceleration of one subject during the no-tracking condition (n = 32 trials). Early components of perturbation-evoked potentials (PEPs) from CZ include the N1 response and late PEPs, as denoted by the hatched area within a 300-ms time interval following the N1 response. The gray dashed line indicates the onset of right tibialis anterior activity (RTA) and the black dashed line indicates the onset of perturbation. B) Example trace of a tracking trial from a single subject. Black line represents the subject's tracking performance and the gray line represents the target waveform.
