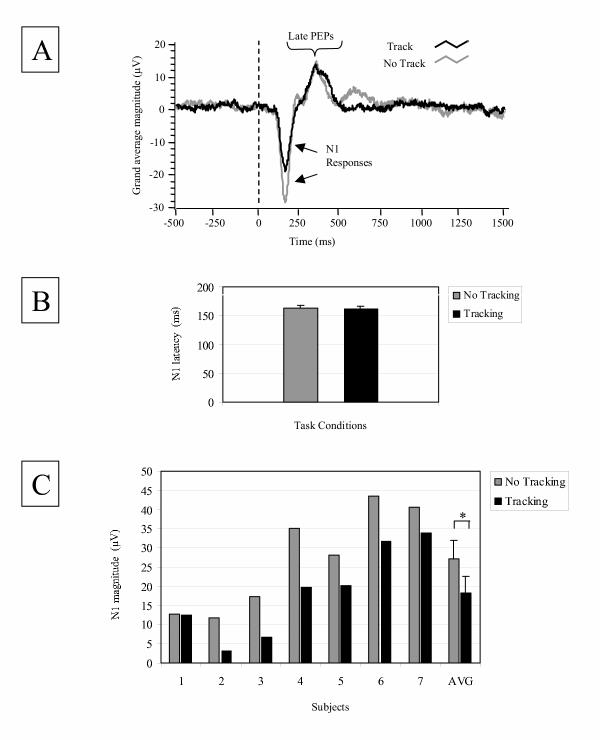
Figure 2.

A) Grand average cortical activity (CZ) during tracking (black line) and no-tracking (gray line) conditions (n = 7 subjects). The black dashed line indicates the onset of perturbation. B) Average N1 latencies and standard errors for tracking (black bar) and no-tracking (gray bar) conditions. C) N1 magnitudes shown for individual subjects and average N1 magnitudes (AVG) for all subjects. Data from tracking (black bar) and no-tracking (gray bar) conditions are shown. Average N1 magnitudes were statistically different between tasks (* p < 0.05).
