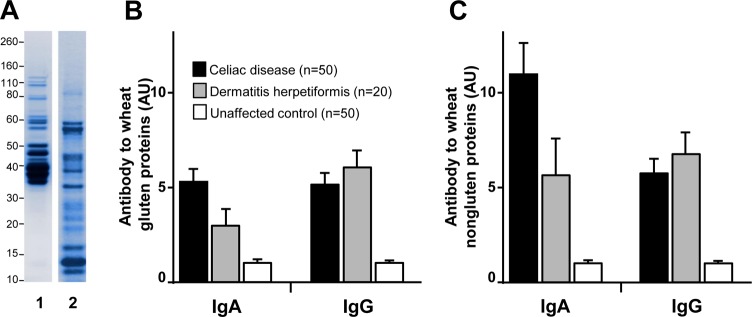
Figure 2.

Antibody reactivity to gluten and to nongluten proteins of wheat. (A) Gel electrophoresis profile of the Butte 86 protein preparations used for the antibody assays: (1) gluten extract (5 μg) and (2) nongluten protein extract (5 μg). Molecular weight markers, shown to the left of the panel, are in kDa. (B,C) Comparison of mean levels of IgA and IgG antibodies to gluten (B) and nongluten (C) proteins in patients with celiac disease or dermatitis herpetiformis in comparison with unaffected controls, as determined by ELISA. Error bars represent the standard error of the mean.
