
Figure 4.
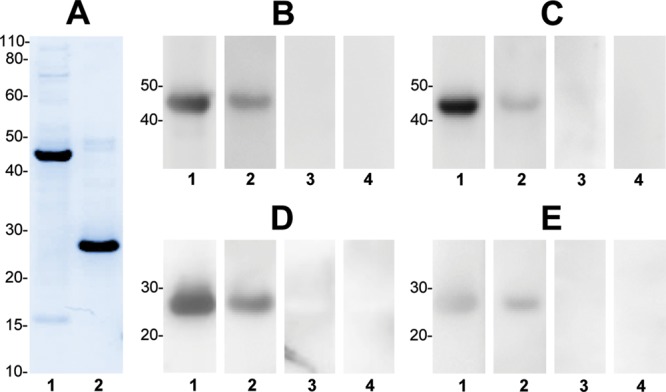
Serum antibody reactivity to a recombinant serpin, representing spot 1a (GI: 224589270), and a recombinant purinin representing spot 2a (BU_purinin #3). (A) SDS-PAGE profile of the purified recombinant serpin (lane 1) and purinin (lane 2) proteins, following Coomassie staining. (B–E) Immunoblotting with the recombinant proteins, demonstrating IgA (B,D) and IgG (C,E) antibody reactivity to serpin (B,C) and purinin (D,E). Lanes 1 and 2 correspond to sera from two representative patients, while lanes 3 and 4 represent sera from two healthy controls. Molecular weight markers are shown to the left of each panel (in kDa).