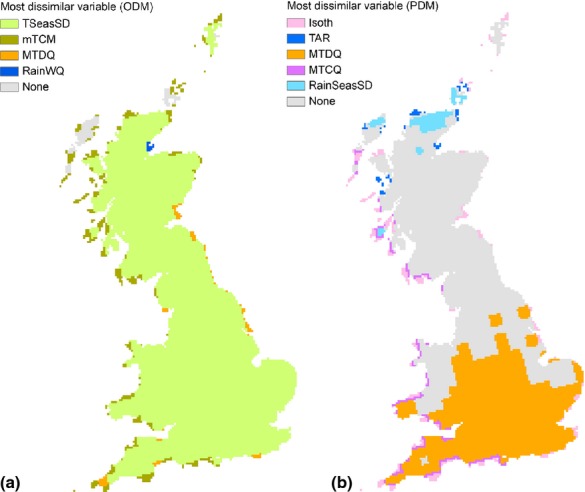
Figure 2.

Most dissimilar variable (MoD) from (a) orchards and (b) pollinators distribution models (ODM and PDM respectively). The two maps show the MoD based on the multivariate environmental similarity surface derived from the predictors used to model (a) orchards and (b) pollinators distribution and mapped in Fig. 1. Grey areas indicate that the distribution of values predicted for the M2050 future is within the range of values observed in present time. It is important to note that MoD is defined over the entire range of values for each predictor, and therefore cannot be used to assess whether the predicted climatic conditions at a particular location differ from the baseline. Variables are defined in Table 1.
