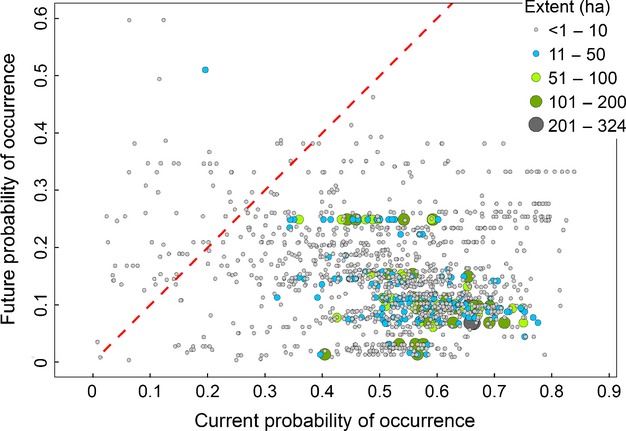
Figure 4.

Current orchards’ extent in relation to current and predicted probability of occurrence based on climate suitability. Current extent measured in hectares is mapped with proportional symbols, using five intervals from <1 ha to 324 ha. The map suggests that most of the largest orchards are currently in areas where the model has predicted probability of occurrence (p) > 0.4, while the same orchards will be in areas with future p < 0.3 and in most cases p < 0.2. The red line marks where current p = future p and highlights that the predicted environmental suitability for larger orchards is lower than the current one.
