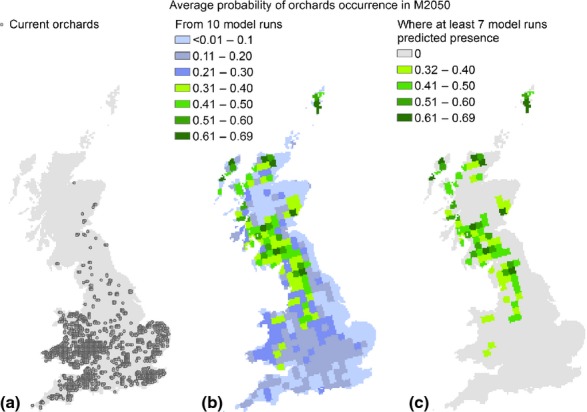
Figure 5.

Current orchards locations and future probability of occurrence. From left to right: the first map (a) shows the locations of the current orchards. The second map (b) shows the orchards’ average probability of occurrence (p) in the M2050 future, as predicted from 10 model runs. The third map (c) indicates the average p for areas where at least seven of the 10 model runs have predicted crop presence, based on the threshold defined in the main text.
