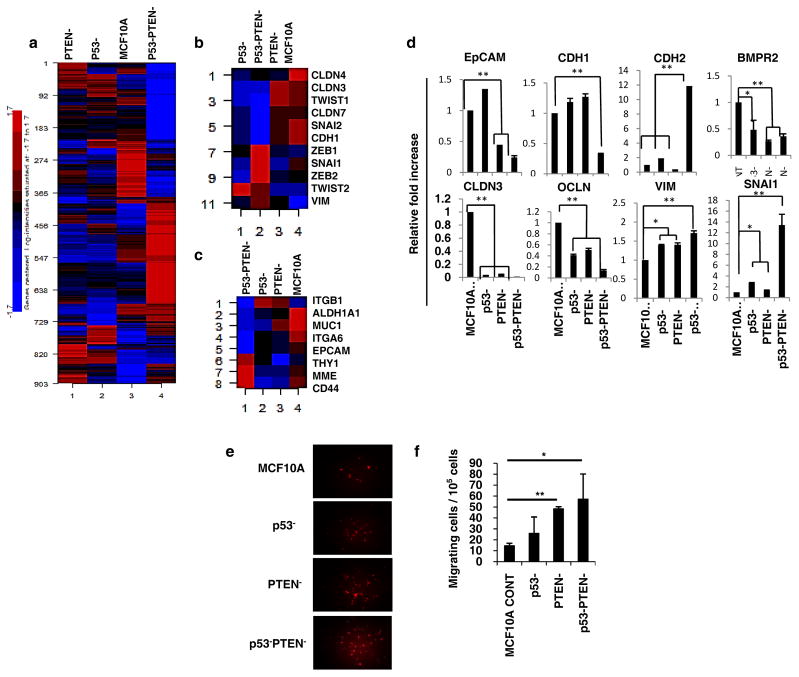
Figure 2. Gene expression analysis of MCF10A p53−PTEN− cells reveal a mesenchymal-like claudin-low breast cancer subtype.
(a) Heatmap and unsupervised clustering analysis of MCF10A, p53−, PTEN− or p53−PTEN− cells. (b, c) MCF10Ap53−PTEN− cells display previously described EMT and CSC gene expression signature respectively. (d) Expressions of EMT genes were validated by RT-PCR. (e, f) Boyden Chamber assay shows an increased motility of MCF10Ap53−PTEN− cells compared to MCF10A, p53− or PTEN− cells in vitro. Means ± SD (n=3),*p≤0.05, ** p≤0.005.

