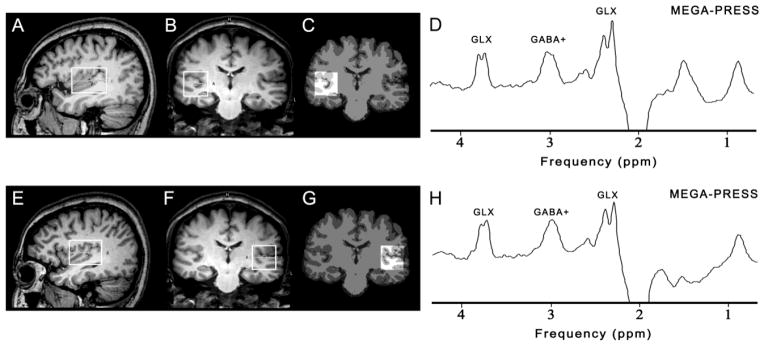
Figure 1.

The position of volumes of interest (4 × 3 × 3 cm3) in the right (above) and left auditory region (below) on sagittal (A, E) and coronal (B, F) T1-weighted images. The corresponding results of brain segmentation are shown for the right (C) and left auditory region (G). Representative GABA+-edited MEGA-PRESS spectra from the right auditory region (D) and the left auditory region (H) are shown.
